Data visualization plays a crucial role in conveying complex sustainability issues to consumers, and one organization that excels in this area is Fashion Revolution, the group behind the annual Fashion Transparency Index. Let’s explore how they leverage data visualization to create a powerful impact in the sustainable fashion world.
Fashion Revolution’s Fashion Transparency Index is a prime example of how data can be transformed into compelling visual stories. This annual report assesses 250 of the world’s largest fashion brands and retailers based on their public disclosure of human rights and environmental policies, practices, and impacts.
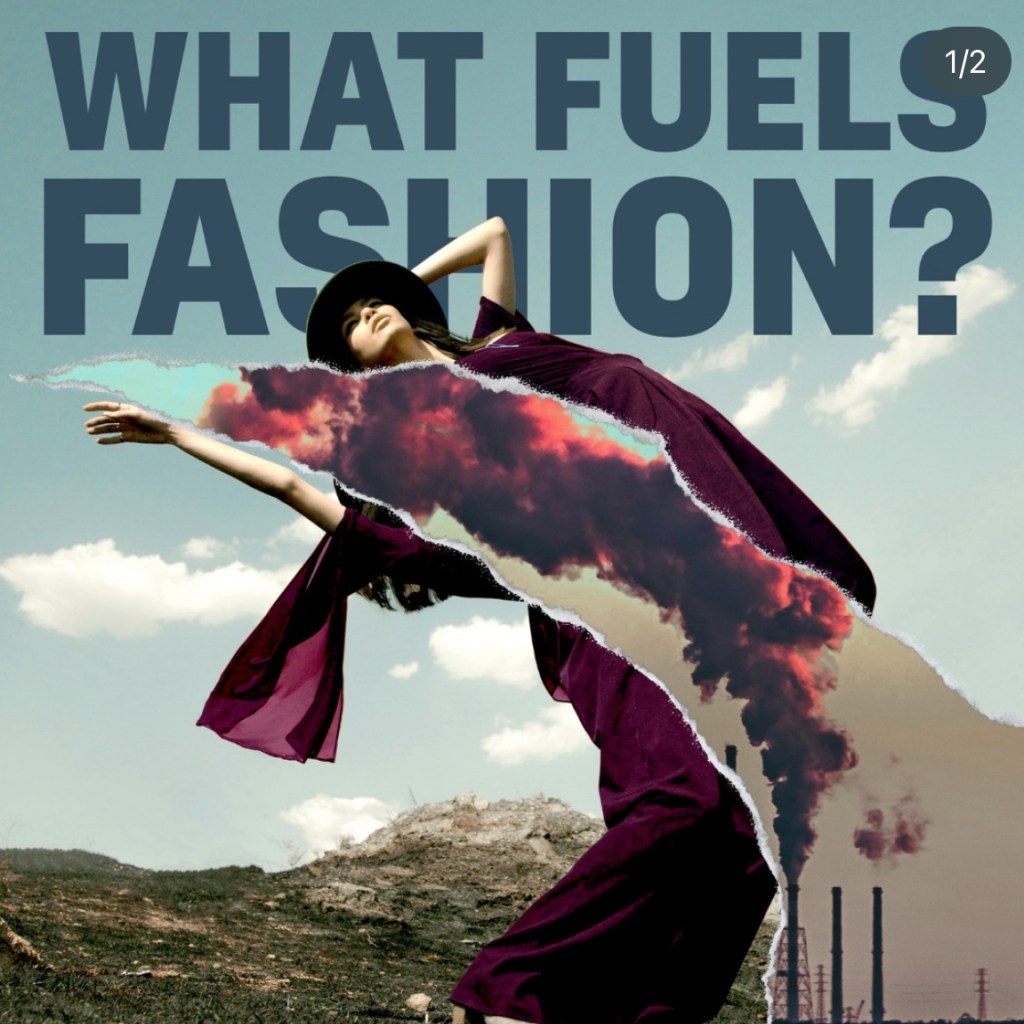
What makes Fashion Revolution’s approach stand out is their ability to distill complex supply chain data into easy-to-understand infographics and social media-friendly visuals. These graphics not only make the information more accessible to the average consumer but also more shareable, which aids in amplifying their message across social media platforms.
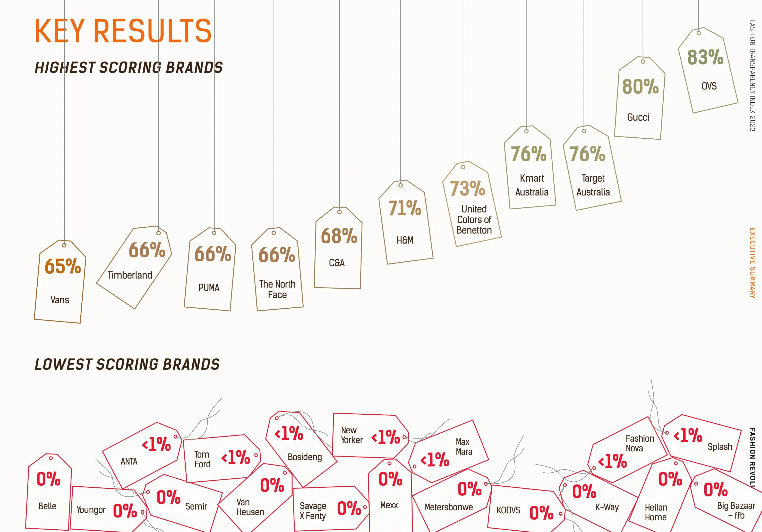
One of their most effective visualizations is a simple yet impactful bar chart that shows the overall scores of fashion brands, ranging from 0-100%. This allows consumers to quickly compare brands and make informed decisions about their purchases.
Fashion Revolution also creates bite-sized infographics for social media, highlighting key statistics from their research. For example, they might showcase that only 4% of brands disclose the number of workers in their supply chain who are paid a living wage. These simple, shareable graphics help spread awareness and encourage consumers to demand more transparency from fashion brands.
By using data visualization, Fashion Revolution transforms information into a powerful tool for consumer education and industry accountability. Their approach demonstrates how effective data communication can drive real change in the fashion industry, making sustainability more tangible and actionable for everyone.
As consumers, we can use these visualizations to make more informed choices about the brands we support. Brands all over can learn from Fashion Revolution’s example, using data visualization to tell compelling stories that inspire action towards a more sustainable fashion future.
Here are some of these visuals! Check out more on their website and on their social media: https://www.fashionrevolution.org/fashion-transparency-index/
(All images are from Fashion Revolution’s website or Instagram)


Leave a comment